Having a robust understanding of OEE (Overall Equipment Effectiveness) goes a long way in reducing costs and increasing return on assets through better asset utilisation and higher efficiency.
For these reasons, companies around the world are working hand-in-hand with their production managers to achieve better OEE and improve overall business results. Today, we will be sharing the essentials of OEE and tips to help jumpstart your company’s process improvement journey.
What is OEE?

Among the various manufacturing metrics available, some are easier than others to help business managers track their Key Performance Indicators (KPI) and OEE is one of such.
OEE measures manufacturing productivity by identifying the percentage of planned production time that is truly productive. Simply put, it gives a measure of the overall effectiveness of a piece of equipment or an entire production line.
From a micro perspective, OEE can tell us:
- When is a piece of equipment idle
- The efficiency of operating an equipment
- The number of products that had failed to meet quality specifications
- How well a production asset is performing against across other assets or different production shifts
What do the different OEE scores mean?
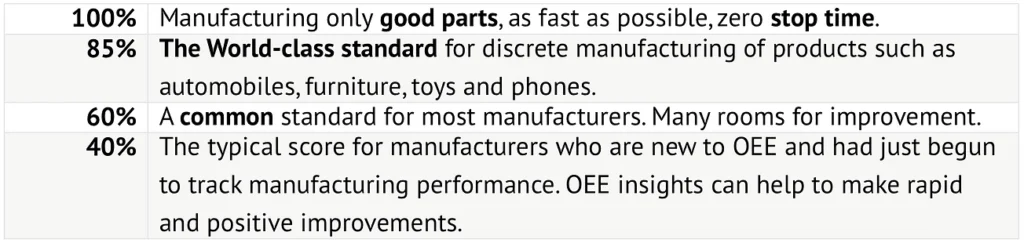
The world-class OEE standard stands at around 85%
OEE scores can be used to compare production plant performance across competitors or industries. Nonetheless, using OEE scores as a benchmark is only the tip of the iceberg. Understanding the reasons and impacts of low productivity in your plant and production equipment is the key to improving OEE scores and, in turn, the overall production performance.
The key components of OEE and how to improve them

OEE encapsulates productivity loss (such as waste in the manufacturing process) through these three main factors:
- Availability
- Performance
- Quality
A systematic approach to improve OEE is to first identify and categorise existing productivity losses into these factors, followed by removing or minimising their impacts.
1. Availability
Availability measures the proportion of actual run time to the planned or scheduled production time. Run time is the period where the equipment is operating and creating value (such as output) to the production process.
Availability loss (i.e. the reduction in run time) is caused by stop time, which is the duration of time where a piece of equipment is scheduled to produce but is not doing so. Stop time may be further broken down into unplanned stops and planned stops.
Unplanned stops refer to the time where a piece of equipment is scheduled to operate but does not do so because of unintended events such as equipment failure or shortages in manpower and raw materials. An example of an unplanned stop which is often overlooked would be the downtime where any equipment is forced to stop operating due to breakdowns in either the upstream or downstream equipment.
Unlike unplanned stops, planned stops are the times when the equipment is scheduled to operate but does not operate due to planned events such as lunch breaks, changeover, cleaning, scheduled maintenance, and quality inspections. *Do kindly note that planned stops are usually excluded from the OEE calculations since there are no intentions to run productions.
In a nutshell, availability helps production managers to see how much of the loss in production was caused by equipment downtime.
2. Performance

Performance compares the actual operating speed of the equipment against its maximum operating speed. The maximum operating speed is sometimes referred to as the ideal cycle time, which is the theoretically fastest time possible for the equipment to produce one throughput.
Performance loss refers to the amount of production loss caused by the equipment running below maximum operating speed. The factors of performance losses are small stops and slow cycles.
Small stops are the times when the equipment stops very briefly for usually a minute or less. It often requires the operators to manually resolve the issue. For instance, an operator may have to repeatedly step in and rectify equipment jams caused by material feed issues. Other examples of small stops include material jams, misaligned print heads and poor equipment designs. Small stops may also be caused by poor work process design issues which are oftentimes overlooked. Unbeknownst to many, small stops are disruptive and they do significantly impair productivity.
Slow cycles, on the other hand, occur when the equipment runs below its maximum operating speed. It could be a result of poorly-maintained equipment or even cases where the operators intentionally run the equipment at a slower speed to ensure that it does not overload and breakdown.
3. Quality
Quality = Good count/ Total count
Quality refers to the proportion of actual throughputs (i.e. good count or outputs), out of all the throughputs produced, that met the specified quality standards. OEE defines good count as production throughputs which were strictly made to meet quality standards on the first time (also known as the First Pass Yield) In other words, throughputs which were reworked to pass the quality checks are not considered as good counts.
Quality loss indicates the amount of time wasted on producing defective throughputs. It includes the time spent on reworking throughputs. Quality losses fall into the categories of production rejects and start-up rejects.
Production rejects are defects produced during stable production. Common examples of production rejects include quality issues such as underweight bags, misalignment of labels and defective packaging.
Start-up rejects refer to the defects produced any time between an equipment starts-up and achieves stable production. It is often caused by suboptimal changeovers of staff to the same equipment or that the equipment had always generated waste after a changeover.
Getting it Right on the First Try
Comprehending OEE is only the beginning of the process improvement journey. OEE challenges us to be proactive in identifying issues and inefficiencies which impact productivity. In our experience, it is more effective to do so when every plant floor employee is involved.

Understanding and reviewing historical OEE data is useful in identifying the root causes of production capacity loss. Moving a step further, having real-time OEE data helps both production managers and operators to mitigate, if not swiftly resolve production problems before they escalate into serious bottleneck situations.
1. Making real-time OEE data available on the production floor
For many years, operators have been manually calculating OEE, often at the end of the day. While managers and operators have worked hard on using the retrospective data to make error corrections and improve on productivity, manufacturers continued to face the challenge of correcting problems as they occur. This poses a threat to the production line as upstream or downstream breakdowns have a direct impact on Availability.
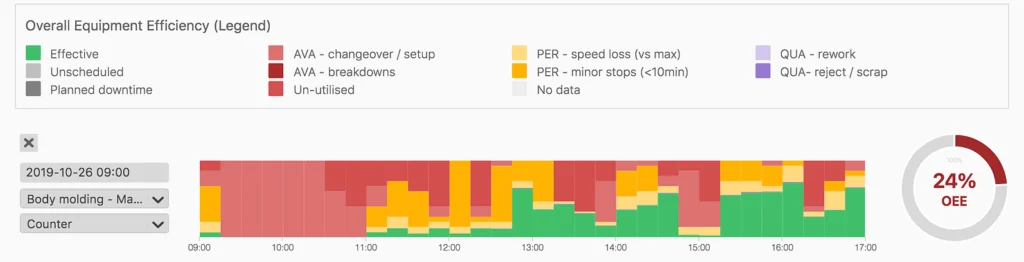
Real-time OEE data is more than just an amalgamated OEE score. It provides real-time performance metrics and detailed but visually-effective analytics on the production lines and equipment. For instance, Auk’s OEE software can categorise and quantify the causes of the unplanned and planned stops affecting the equipment.
With real-time OEE data displayed on the production floor, supervisors can work together with the relevant operators to make simple yet effective adjustments such as staggered break times to reduce the number of planned stops as much as possible. Furthermore, having a live-display provides greater transparency on the performance of each operator, and it serves as a healthy motivation for them to become even more efficient.
2. Cultivating individual responsibility to reduce performance loss
Many a little makes a mickle. Conversely, frequent small stops may lead to significant production losses in the long-run. Before having real-time OEE data, operators may have been overlooking the short spurts of machine downtime as a result of small stops. As such, they might have accepted the status quo and did not think of ways to improve it.
With real-time OEE, operators might become more invested in preventing such stoppages and thought more critically of ways to fix the problems. They could perhaps sound out to their managers on the diminishing returns of using an outdated machine and suggest further improvements. This new sense of awareness and responsibility for their work is known to have a positive spill-over effect on their colleagues. As a result of which, companies have often seen an increase in OEE from 10 to 20%.
3. Validating investment decisions
Purchasing new production equipment can be expensive and poor investment decisions could result in long-term debts of at least 10 years. On the one hand, it is more economical to spend the money on maintaining and repairing existing machinery. On the other hand, historical data have shown that current production levels are falling below expectations and the company suspects that the existing equipment is no longer performing.
With an OEE hovering at a mere 40%, should the company purchase new types of machinery to increase output or is it unnecessary? During such pressing times, real-time OEE data can help us do the math and make more informed decisions.
By working with the operators, technicians and supervisors to monitor real-time OEE data, insights may be gathered to show that existing equipment is working perfectly fine. The culprits for the low production levels were mainly due to the under-utilised pockets of production time where many types of machinery were idling more than they should. As we can see, through the simple act of monitoring OEE data, the company would know exactly how they can run existing ones more effectively and increase productivity without breaking the bank.
Bringing positive changes to your production floor
OEE is more than just a number. Coupled with the correct analytical tools and a committed team, any manufacturer can successfully visualise, quantify and minimise their production loss. In the labyrinth of information and KPIs to meet, OEE helps companies and manufacturers to be laser-focused on the necessary areas of improvements and achieve maximum results. If you are keen to further explore the untapped potential of your production plan, Auk is here to help.