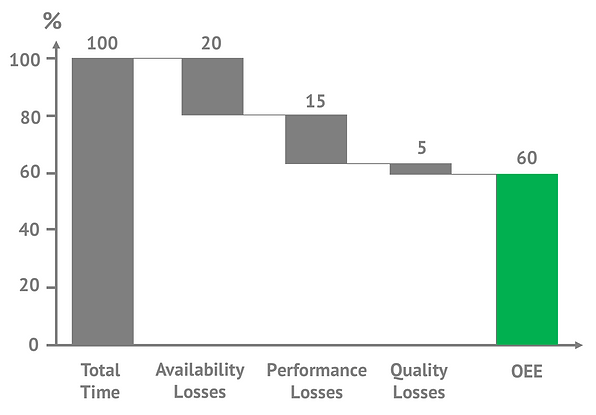
Most managers and operators working in the manufacturing industry would have heard of ‘Overall Equipment Effectiveness’ (OEE) before. A framework to measure the productivity and efficiency of a process, OEE compares your actual production to the theoretical ‘perfect production’ and indicates the planned production time that is truly productive.
Similar to the Gross Domestic Product (GDP) of a country, OEE is a powerful figure that enables you to benchmark across industries or use as a baseline to track progress. While OEE is simple to understand, there are some mistakes which organisations often make. Here are the 9 most frequent mistakes which you can avoid when measuring OEE for the first time.
1. Calculating OEE Manually
For a long time, organisations have been deploying operators to record and collect data on paper logs before transferring them to a spreadsheet to calculate the OEE. Such manual methods were labour-intensive and often plagued with issues of accuracy, precision and timeliness. Other reasons why manual OEE calculation is not ideal includes:
- Difficulties in tracking micro-stops and speed losses
Micro-stops are minor stoppage losses that result from a machine stopping for brief periods due to temporary problems. While they may be difficult to spot and tracked by the naked eyes, micro-stops often lead to high performance loss. If micro-stops are unnoticed and left unchecked, manufacturers could lose days of productivity.
- Tracking may be done incorrectly
The reaction time and astuteness to notice availability, production and quality losses may differ from one operator to another. Manual inputs such as the time and duration of machine downtime would, therefore, be subjective and inaccurate. There is no remedy to ensure manual inputs are recorded correctly and accurately. Oftentimes, inaccurate manual inputs are compounded and processed at the end of the day and the final OEE score would be unreliable.
How to do it right:
- Use real-time data to calculate OEE. This is achievable through the adoption of IoT production monitoring systems which can track production activities more accurately and precisely.
- After implementing Auk’s Industrial IoT system, a food manufacturer no longer relied on manual methods to calculate their OEE. The manufacturer was able to stream real-time and round-the-clock operational data to calculate it automatically. As a result, its production facility’s equipment output increased by 30% while man-hours were reduced by more than 25%.
2. Not focusing on the operators
Operators are a vital component of the OEE implementation and ongoing process. They are primary in providing additional insights and inputs at every step of the manufacturing flow, as well as using the OEE score and other data to execute change and increase efficiency. If operators were asked to provide inputs for OEE without knowing the purpose behind it, they may find it a waste of time and refuse to do so. Excluding operator involvement in the implementation process can lead to reduced participation and commitment to improving OEE.
How to do it right:
- Provide training to help operators understand the importance of OEE and how it can improve the productivity of the company.
- Encourage operators to share more insights into the production process. When effecting changes to improve OEE, do remember to involve the operators and give due credits to them. This will help them feel included in the improvement process and recognise that their inputs matter.
3. Failing to understand the OEE Score
OEE score is an important measure of productivity but the core factors used to calculate it are just as important. Organisations often focus too much on the absolute OEE score and fail to investigate its core components – Availability, Performance (minor stops and speed losses) and Quality (rejects and reworks).
As some of you may have known, one shortcut for deriving OEE would be to divide the actual production in a certain period by the expected production in the same period. This process bypasses the aforementioned three components but it may not be a good thing as the OEE score alone does not give insights on reasons why performing is peaking or plateauing. It only indicates whether the manufacturing floor is performing better or worse.
How to do it right:
- Break down the OEE score into Availability, Performance and Quality and investigate where the underlying production losses are incurred.
- Recognise the sources of losses would help to nib the issue in the bud as soon as possible. Sources of production losses include unplanned stop caused by a piece of bottleneck equipment (availability loss), too many disruptive small stops (performance loss) or even too much rework (quality loss).
4. Benchmarking OEE scores incorrectly
“You can’t compare apples to oranges, they’re just not the same thing”
Comparing the OEE scores of different production plant and equipment is akin to comparing apples to oranges, even if you were to operate in the same industry as them. Each plant and equipment have differing goals and objectives. Some may be specialised for manufacturing small batches of more variants whereas others produce more of a single product.
How to do it right:
- Do not take the average of your manufacturing floor’s OEE and compare it to other facilities. OEE scores should be specific to each production line or equipment.
- Compare each of your equipment’s OEE score to the equivalent equipment in another facility. You may want to review the results with discretion because even the same equipment may have varying maintenance schedule and input quality. The quality of operators operating the equipment may also be a confounding factor.
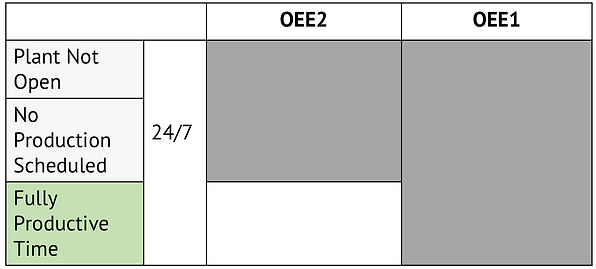
Take into consideration that some companies use OEE2, which measures the percentage of planned production time that is truly productive whereas others use OEE1 (sometimes known as the Total Effective Equipment Performance) which takes into account the total time (i.e. 24/7), regardless of public holidays, planned shutdown periods or lunch breaks. Understand which is more suitable for your company and compare your OEE to the same OEE used by other facilities.
5. Insufficient analysis on OEE and TEEP
Planned stops such as lunchbreak, cleaning, scheduled maintenance, and quality inspections are often excluded from OEE calculations because there are no intentions to run production during this period. Many organisations, therefore, ignore these planned stops and only focus on unplanned stops.
While this may help to increase OEE scores, you are neglecting a huge ‘proportion’ of lost time which could potentially be used to produce outputs. Imagine the extra production time you can garner by simply reducing the time spent transiting from one shift to another. Fewer of these planned stops can effectively result in higher run time.
How to do it right:
- Consider including planned stops in your OEE calculation to identify opportunities to minimise time lost and increase production
- Do not favour the status quo. Use the data collected to find out if there may be more efficient ways to schedule planned stops so that they make up a smaller proportion of your Total Effective Equipment Productivity (TEEP). This would effectively increase your planned production time.
6. Using the wrong cycle time
Cycle time is defined as the shortest time in which you can produce one part. It excludes losses like downtime, defects, and other delays. In other words, cycle time translates to the fastest speed your machine can operate to produce outputs in ideal conditions.
Many organisations, however, make the mistake of using average run rates or throughputs as their cycle time. While this may be intuitive, it is problematic because the average run rate would always be smaller than the ‘true’ cycle time. This would cause inflation in the OEE score and production managers and operators may be misled into believing that they are already producing close to the maximum available throughput when there is still potential to improve.
How to do it right:
- Be sure that the current cycle time used in your OEE calculation is the theoretically shortest time possible. Often time, the cycle time provided by the equipment producer is a reliable figure to follow.
- There are, however, occasions where the cycle time is understated by the equipment producers for various reasons. If you find yourself producing unrealistically close to the cycle time, consider discussing with the producers and find out if the ideal cycle time can be further shortened.
7. Inclusion of rejects as ‘good counts’
Under the ‘Quality’ component of OEE, only production throughputs which were made to meet quality standards on the first time were considered ‘good counts’. This means that any rejects or reworks are excluded from ‘good counts’.
8. Changing too many things at one go
It can be worrying when you calculate OEE score for the first time and you realise your manufacturing plant is performing below standard. You may be at a loss for what to do because there are so many issues that require fixing. Should you be channelling resources into minimising small stops, breakdowns or production rejects?
“Every complex system, including manufacturing processes, consists of multiple linked activities, one of which acts as a constraint upon the entire system.” – Dr Eliyahu Goldratt, The Goal
How to do it right:
- Rather than attempting to fix all the problems at one go, Dr Goldratt suggests first identifying the one constraint that is most affecting production and resolving it before improving the next constraint.
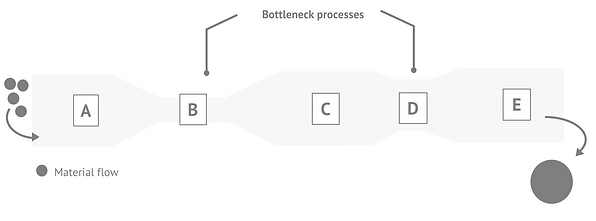
By narrowing down to improve the single most disruptive constraint would help to optimise your production floor’s resources within the shortest possible time.
Do note that a constraint may be referred to as a bottleneck but a bottleneck may not always be a constraint.
9. Not using OEE to your advantage
OEE is not an aesthetic eye-candy. Its potential to improve your manufacturing plant would be limited if it was only used to tell production managers and operators how well they are doing. OEE and data go hand-in-hand with the business objectives of any organisation and the management should work with the production floor to identify and adopt good practices while eliminating the bad ones.
By analysing and using the insights gathered from OEE, a client in the beverage industry was able to achieve more than 80% increase in their throughput productivity. As a result of which, existing machines became more efficient and the Finance team was able to save on large capital expenditure (CapEx) previously required for investment in capacity expansion.
Prevention is better than cure. Implementing and leveraging on OEE correctly would go a long way in driving performance and provide qualitative insights for decision-making.
If you are interested to find out more about OEE and how Auk’s industrial IoT systems can help you to increase yield while reducing defect rates and value stream losses at every step of the manufacturing flow, we are here to help.