The 2 Essentials Needed to Commence Remote Operations
Like other companies, 2020 has been a tough year for many manufacturers. Lower demands, lesser mobility and greater regulations around health, safety and workplace protocols have thrown manufacturers into a phase of uncertainty and unpredictability. With work-from-home arrangements in place, the longstanding ways of manufacturing are forced to change and it can be unsettling. But every cloud has a silver lining and this unpredictability has ushered in a new era of remote manufacturing operations—less face-to-face interactions, more digital savviness and greater transparency. While production line managers and operators may see less of each other in this new work arrangement, there should be no compromise to the quality of production.
Leading research and advisory firm, Gartner, predicts that by 2024, half of the factory work will be done remotely. This will inevitably impact jobs and shift schedules but manufacturers and operators embracing remote manufacturing as a way of life could very well be building resilience and laying the foundations today for the opportunities of this near future.
As part of business prudence, however, manufacturers should be wary of committing too much resources upfront to kickstart remote operations. In this article, we explore two essentials that will support manufacturers in incorporating more remote operations into their daily manufacturing schedule, while keeping costs low and improving factory performance visibility.
Access to Accurate Real-time Data
“Having access to real-time data is the one requirement that most remote workers need and there is no exception for factory operators working remotely. With remote access to real-time data comes actual visibility of the production floor.
To obtain real-time factory data at remote locations, live data has to be automatically transmitted from machines to a centralised data repository at a near-instant frequency. However, many manufacturers are still practising manual data collection.
Manual data collection requires plant operators to go around the production floor at the end of each shift or day to ‘guesstimate’ when downtimes or breakdowns occurred, how much scraps were produced, etc. These data are recorded using pen and paper and later transferred to various spreadsheets to draw insights and develop action plans.
Prior to remote working arrangements, manual data collection has already proven itself problematic. Firstly, it is arduous, time-consuming and vulnerable to the biases and mistakes of the operators collecting and recording the data. Smaller issues often go undetected either because they are not noticeable by the naked eyes of the operators, or they are perceived to be irrelevant. Secondly, it results in limited performance improvements because analysis and metrics such as Overall Equipment Effectiveness (OEE), Capacity Utilisation are based on incorrect and incomplete datasets. Thirdly, the data collected is outdated. As information is only recorded at the end of each shift or day, there is a wide interval between the time problems occurred and the time they are noticed. This decimates opportunities for operators or engineers to promptly intervene and resolve quality problems, stoppages or breakdowns.
In the context of remote working arrangements, relying on manually collected data at the end of each shift or day can cause problems to further compound, aggravate and result in significant productivity and economic trade-offs. One of our clients in the instant coffee manufacturing industry was a victim of this. Every now and then, the coffee manufacturer faced the issue where some production line managers or operators would make the mistake of scheduling the wrong SKUs for production. Such wrong productions are often detected too late – either at the end of the day, or worse, a few days later at the scheduled day of delivery. Not only does this generate wastes in terms of resources (e.g. raw materials, storage), but it also heavily impacts customer satisfaction level because orders could not be delivered on time.
By contrast, when data are automatically collected and aggregated from machine sensors, production line managers or operators can have real-time visibility of each production line and machine, as well as the SKUs and quantities that are being produced. These data can be displayed on dashboards and even tablets so schedulers and production managers can click into specific SKUs to check on their production status. Should the wrong SKUs be produced at the wrong time or production line, alerts would be sent out so the management or schedulers can step in to rectify the issue and make sure the planned schedule is followed through – all before it is too late.

Automated collection of data from machine sensors in real-time is critical to successful remote operations. They eliminate the lag-time between observations and actions, provide production line managers and operators with both a birds-eye and micro view of the operations on the production floor, and enable them to quickly detect and address problems as they occur.
Easy Visualisation of Data
Now that accurate real-time data is available, how can senior executives, production line managers, production schedulers or operators remotely leverage this complex data in an efficient, yet effective way? The key is to responsively display the data in useful, visual formats for easy analysis and identification of trends or problems.
“If we cannot measure it, we can’t improve it. If we cannot visualise it, we don’t know where, what and how to improve it.
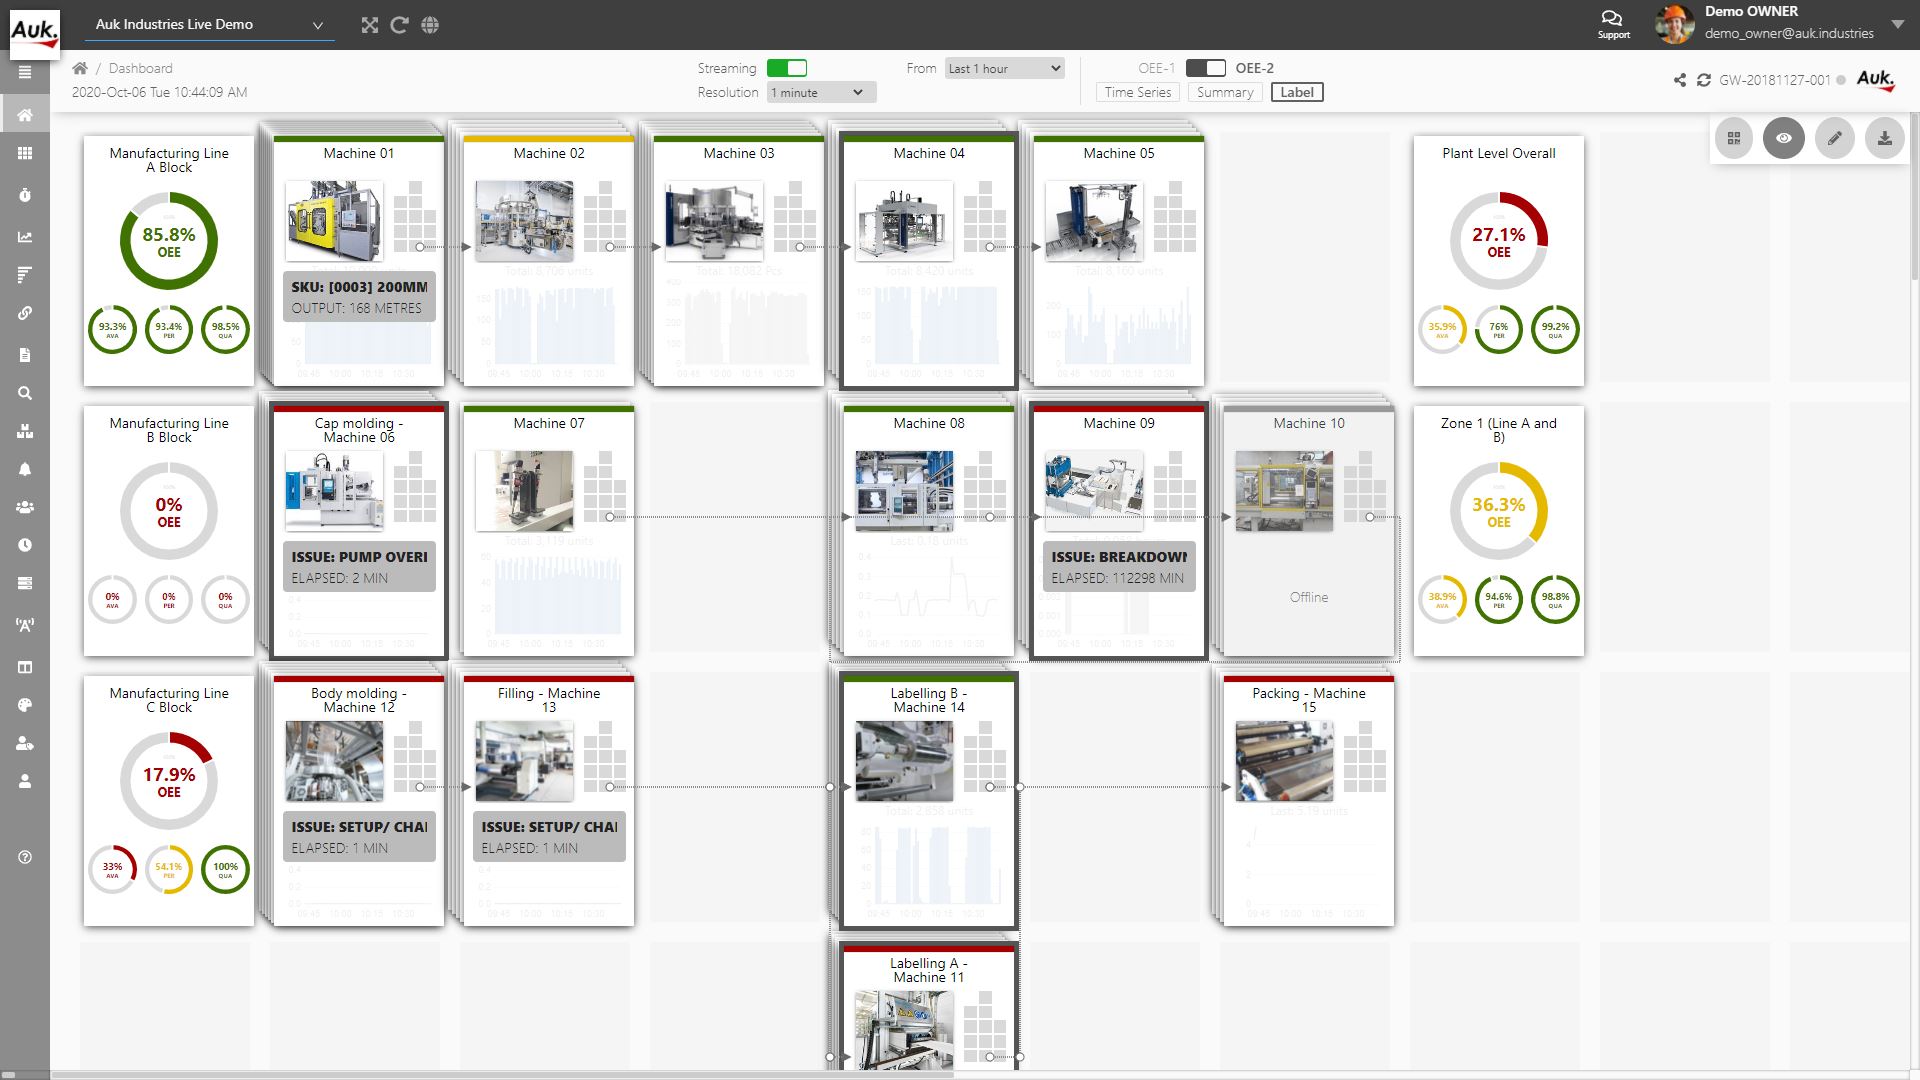
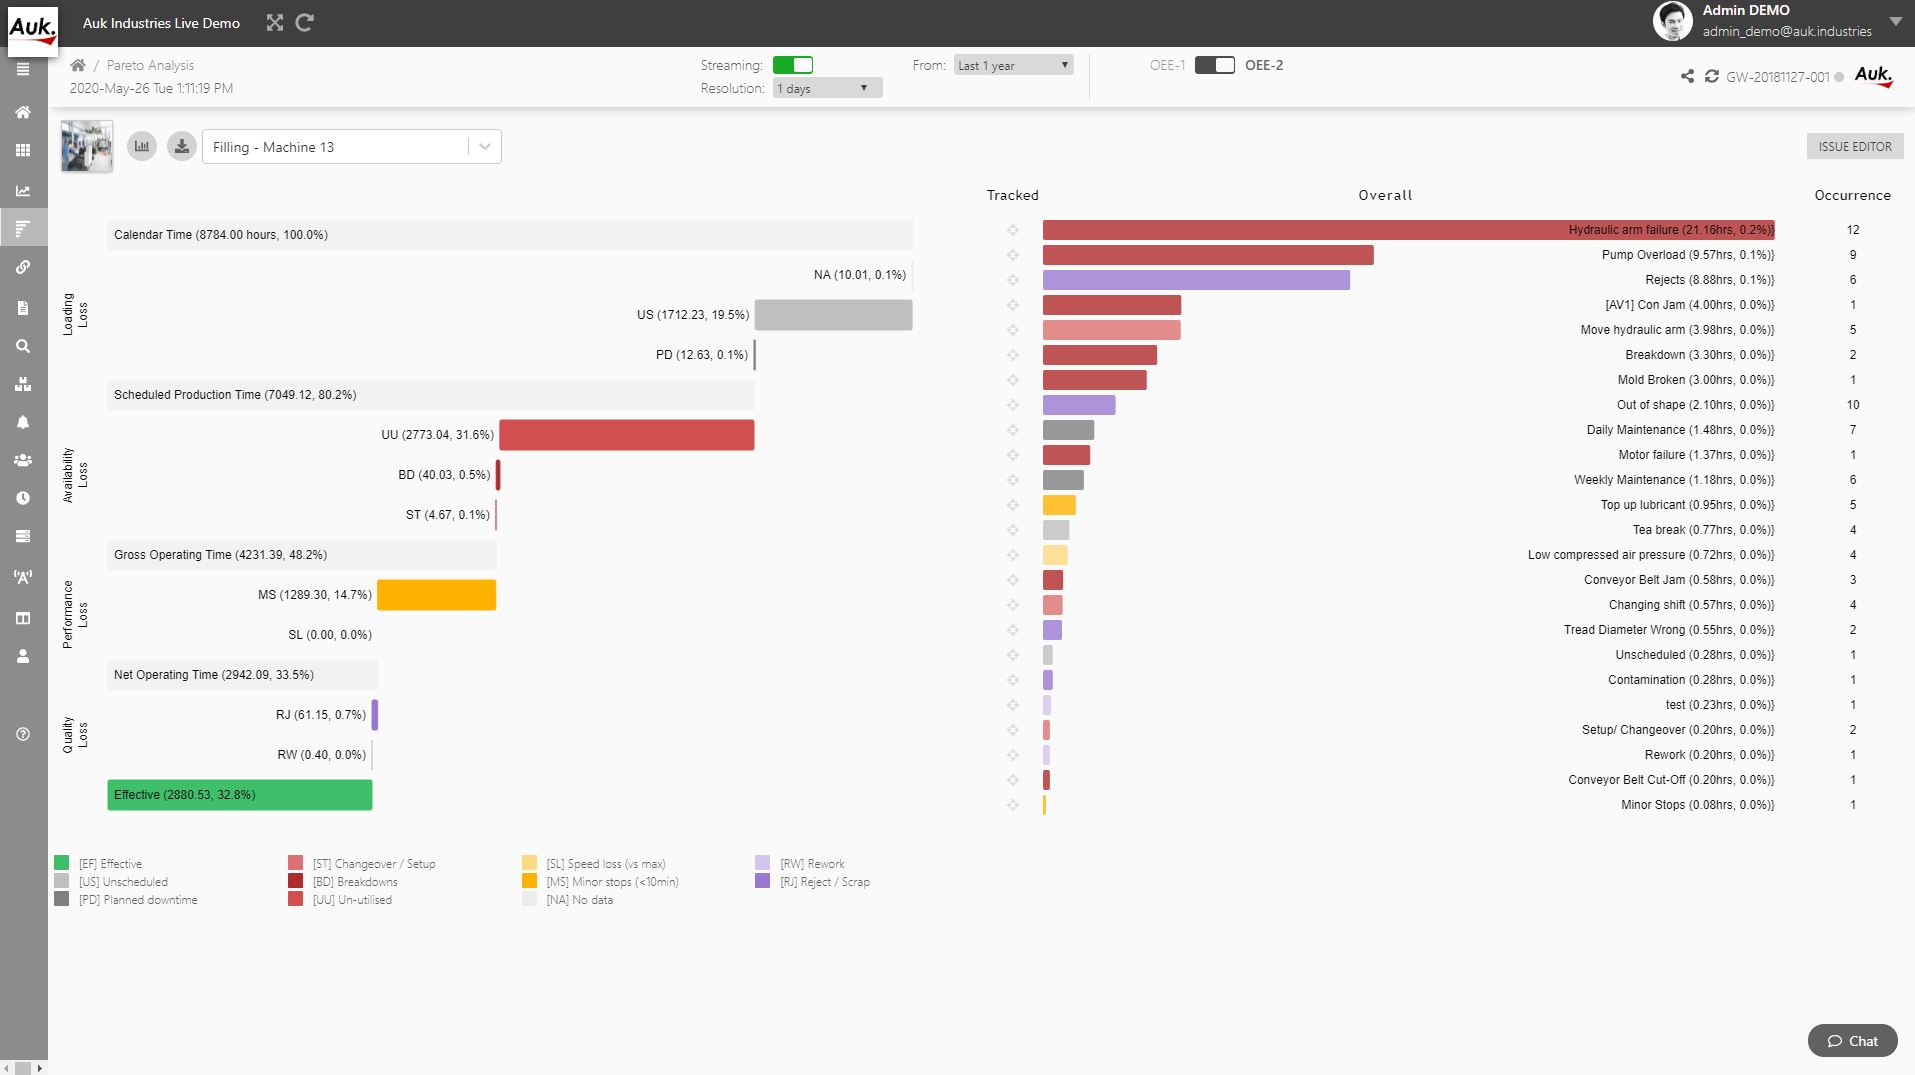
Data visualisation tools provide factory staff and executives with operational visibility on production floor performance, identify bottlenecks and pinpoint the batches which are not producing according to stipulated quality requirements etc. One example would be a manufacturing dashboard which is a real-time visual representation tool tracking the productivity of a manufacturing process. It uses a combination of graphs, charts, tables and diagrams to show different production KPIs or metrics according to machines, production lines, shift, minutes, day or month. Data displayed on the dashboard is concise, easy-to-read and can be further ‘clicked into’ to provide more detailed information such as breakdown causes for the maintenance team to look into. Some visualisation tools even allow the process or quality engineers to perform Pareto analysis or root cause analysis across devices, wherever they may be. When a non-conformance is found, an alert may be triggered in the same platform and correction actions can be promptly taken.

Tip: Select a real-time monitoring system and analytics platform that is integrated with a responsive dashboard so real-time data and parameters such as temperature, pressure, current, rpm are automatically captured and synchronously displayed on a dashboard with little lag-time. As such, managers can better stay in lockstep with operations rather than diverting attention to extract data from multiple siloed sources and feeding them into the visualisation system.
Conclusion
Contrary to popular beliefs, starting remote operations is less complicated than it seems. The two cornerstones when approaching remote operations in a lean way are: access to accurate real-time data and easy data visualisation. Once the integration of remote operations is successfully underway, manufacturers can then explore more sophisticated tools to scale remote operations further.