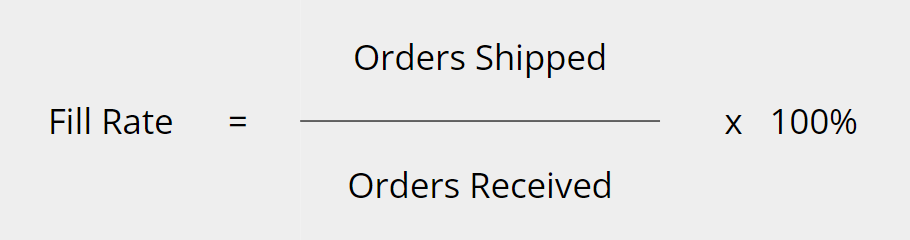
In today’s competitive manufacturing landscape, maximizing efficiency is no longer a suggestion – it’s a necessity. While high fill rates ensure on-time deliveries, metrics such as Overall Equipment Effectiveness (OEE) helps unlock the true potential of your operation.
1. OEE as a metric
Think of OEE as a secret weapon in manufacturing. It goes beyond basic production numbers to reveal how efficiently your machines are truly running.
OEE serves as a critical metric that provides deeper analysis, measuring how effectively machinery and equipment are utilized. An OEE of 100% indicates that your machines or production lines are running as fast as possible, with zero downtime and producing all good parts.
Essentially, a high OEE denotes a highly efficient manufacturing operation, while a low OEE indicates that there is untapped capacity that can be optimized.
2. A comprehensive approach to unlock maximum potential
As a comprehensive metric, OEE evaluates how effectively manufacturing equipment is utilized to produce quality products within the scheduled production time.
Performance Comparison
In simpler terms, OEE is a starting point for factories to compare how well their machines are running compared to their internal baseline, industry averages, and even how different work shifts or products perform.
By having clear and accurate OEE data for all their machines, factory teams can quickly identify machines that aren’t performing well. They can then investigate the biggest reasons behind this underperformance (often referred to as the “six big losses”) and take steps to improve the factory’s overall productivity, especially if these underperforming machines are bottlenecks in the production process.
The OEE Gap: A Huge Opportunity
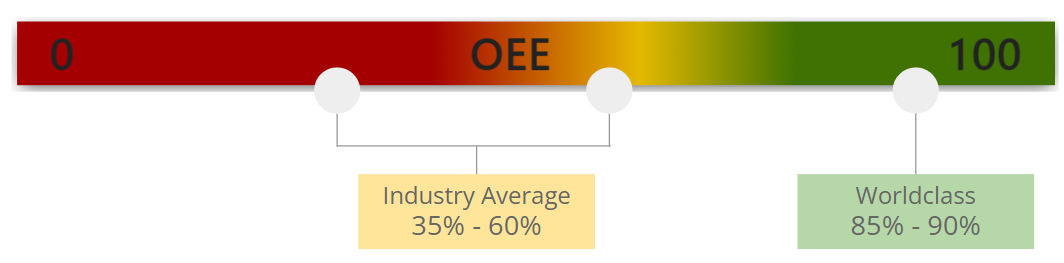
Studies across hundreds of factories show a significant gap in OEE for discrete manufacturing before improvement. The average OEE falls between 35% and 60%, which is far lower than the best-in-class standard of 85-90%. This means there’s a tremendous opportunity for most factories to significantly improve their production output.
The Business Impact of Improved OEE
Here’s how improving OEE can benefit your business in two ways:
- Higher Revenue and Margins (for companies in high demand): If your product is in high demand, improving OEE can significantly increase your output without buying new equipment. For example, if you’re currently producing 1,000 units per month with an OEE of 50%, increasing OEE to 60% allows you to produce an additional 200 units per month. This translates to higher revenue and margins because your fixed costs remain the same while you’re producing more units (lower unit cost).
- Reduced Variable Costs (for companies with flat demand): If demand for your product is steady, improving OEE allows you to achieve the same output with fewer working hours. Let’s say you currently need three 8-hour shifts to produce 1,000 units per day. By improving your OEE from 50% to 75%, you can produce the same output with just two 8-hour shifts, reducing your overall variable costs (e.g., labor and utilities).
3. How to Calculate OEE?
Understanding OEE requires a breakdown of two key concepts: Total Effective Equipment Performance (TEEP) and OEE itself.
TEEP (OEE1): A Broader View of Efficiency
TEEP considers your factory’s overall capacity by measuring performance against total calendar time, including non-production hours. This helps determine if additional production lines or facilities are needed, if you have maximized your working hours. In practice, TEEP can be calculated using the same equation as OEE2, but expressed as a percentage of total calendar time.
OEE2: Focusing on Scheduled Production
OEE2 takes a more targeted approach, analyzing machine performance based on scheduled production time. This excludes planned downtime like lunch breaks or holidays. Essentially, OEE2 reflects how effectively you utilize your machines during designated production hours.

The figure provides a visual representation of the different factors and losses involved in calculating OEE and TEEP, illustrating how each component contributes to the overall effectiveness and performance of the equipment. This helps in identifying areas for improvement in the production process.
Understanding OEE Components
OEE is derived from four primary loss categories, each impacting overall efficiency:
- Loading Losses (L): Planned downtime such as lunch breaks, holidays, or unscheduled production time. If you deduct the planned downtime and unscheduled production time from the total calendar time, you will get the scheduled production time

If a factory runs a single 12-hour shift with a 1-hour lunch break, their scheduled production time is 11 hours. Their Loading Factor would be 11 hours / 24 hours = 45.8%.
- Availability Losses (A): Events that halt scheduled production for a significant duration (typically several minutes or longer). This includes breakdowns and changeover time.
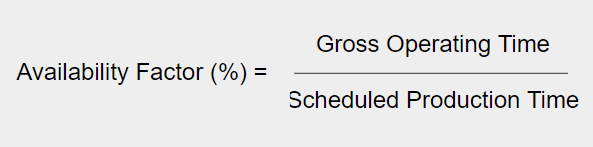
Let’s say the factory from the previous example experiences breakdowns totaling 1.5 hours and changeovers totaling 1 hour within their 11-hour scheduled production time. This gives them a Gross Operating Time of 8.5 hours (11 hours – 2.5 hours). Their Availability Factor would be 8.5 hours / 11 hours = 77.3%.
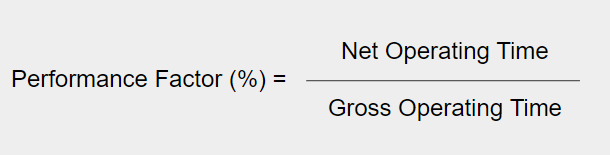
- Performance Losses (P): Factors that cause machines to operate below the ideal cycle time when running. This includes minor stoppages and speed losses. Ideal Cycle Time is the theoretical fastest possible time to manufacture one piece. When it is multiplied by Total Count, the result is Net Operating Time – the theoretical fastest possible time to manufacture the total quantity of pieces.
- Quality Losses (Q): Products that don’t meet quality standards, including rejects and reworks. The time taken to produce a defective product could have been used for good output. To translate defective products into ‘time’ value, simply multiply the number of rejects and reworks by the ideal cycle time.

Bringing it All Together:
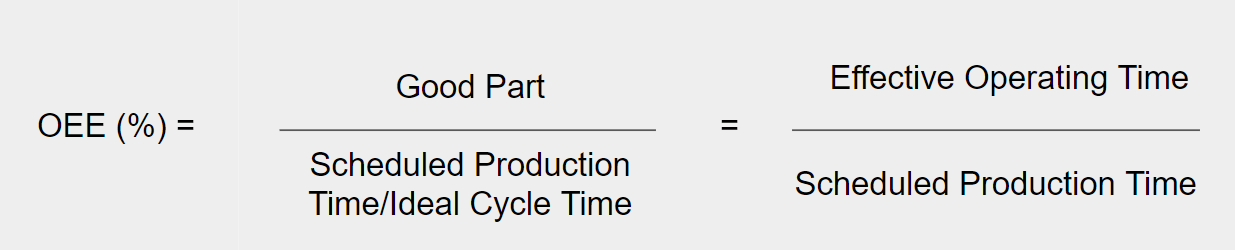
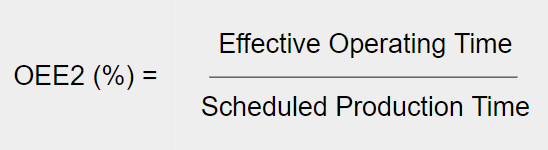
OEE2 essentially represents the ratio of effective operating time against scheduled production time.
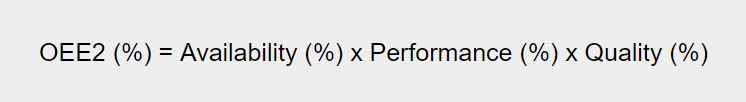
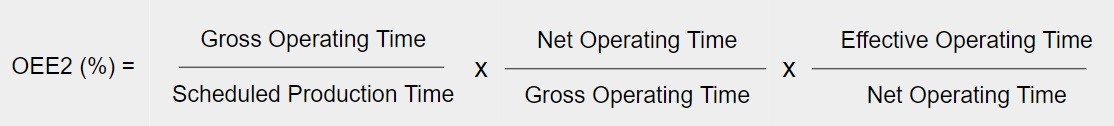
With simple mathematics, the above calculation is reduced to the equation below:
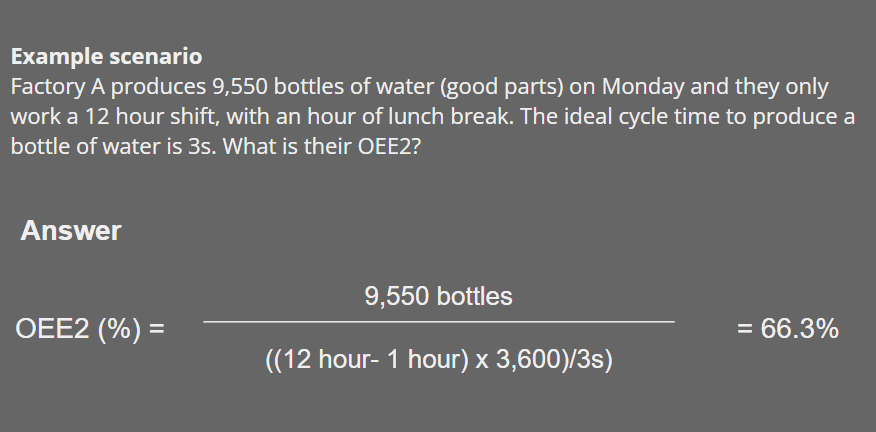
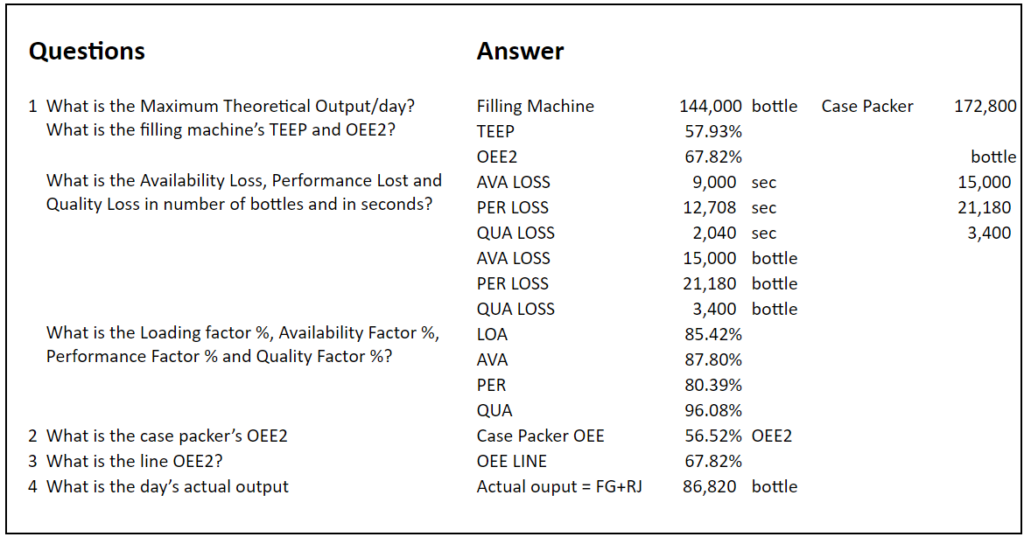
The above calculations are based on time. An alternative way to calculate OEE2 or TEEP is to change from ‘time’ to ‘pieces’ (or any output unit).
Case Study 1:
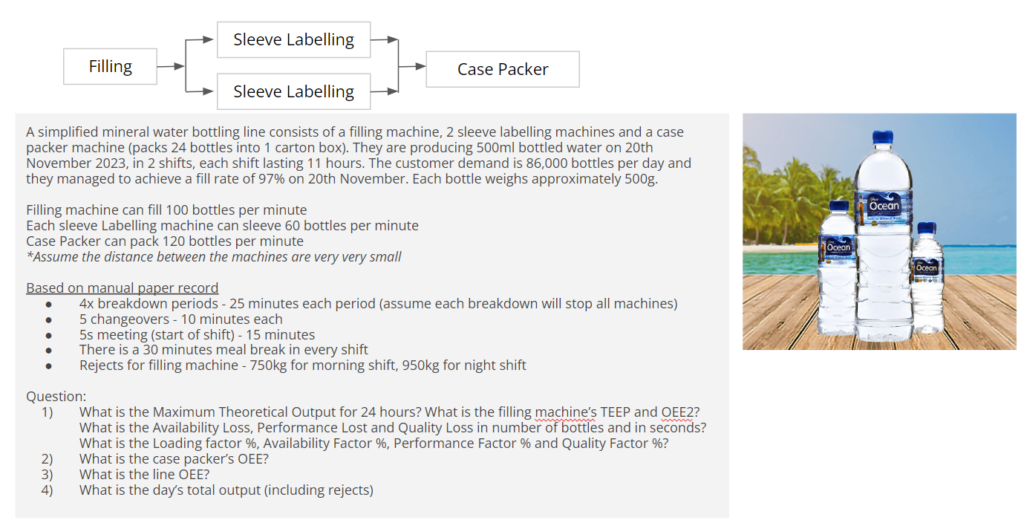
Case Study 2:
4. Common Issues with Manual OEE Data Collection
Having a metric like OEE to actively track and improve your factory’s efficiency and capacity is crucial. However, manually collecting the necessary data, calculating OEE, and making it visually available and actionable to stakeholders is challenging.
- Inaccurate Data: Most downtime (losses) durations and reasons are estimated since it’s impossible to monitor machines or production lines 24/7. Minor stoppages and speed losses are nearly impossible to collect accurately.
- Low Data Resolution: The production team often collects data only once per shift. In more rigorous factories, data might be collected on paper every hour, but this is not very common.
- Delayed Data: Data collected on paper must be transferred to a digital format (usually Excel), cleaned, and processed before it can be visualized. This delay prevents timely remedial actions.
If the budget permits, investing in a solution that provides real-time data directly from machines and production lines, along with a performance dashboard, offers significant benefits:
- Accurate Loss Identification: With real-time and reliable data, production teams can pinpoint top losses accurately.
- Timely Action: Immediate access to data allows for swift actions to address root causes and improve productivity.
In conclusion, while manually tracking OEE has its challenges, leveraging real-time data solutions can significantly enhance the ability to monitor and improve factory efficiency effectively.
Don’t wait to streamline your OEE tracking. Contact Auk Industries today to explore how our plug-and-play hardware and ready-to-use software platform can make your digital transformation painless and super fast!