What is line balancing?
Line balancing is the arrangement of machine capacity and operators in a line to eliminate bottlenecks and excess capacity. When a production line is perfectly balanced, the cycle time is equal to the Takt time—the rate at which products should be produced to meet the rate of customer demand.
Takt time = Available working time / Customer demand
E.g. if the target is to produce 400 units/day within an 8 hour shift,
Takt time = 480 minutes / 400 units = 1.2 minutes
How to achieve line balancing?
Collect accurate, bias-free data
Line balancing is not an easy task. The task is only more challenging when manufacturers are limited to discrete data manually collected using stopwatch and papers. Bias may also be introduced into the data through such manual collection means, rendering the data inaccurate.
Prior to embarking on any line balancing efforts, we recommend that manufacturers obtain accurate data to understand and capture the current state—what is the cycle time, how are each station, line or group of machines performing along the value stream etc.. To collect such accurate and bias-free data, manufacturers should do away with manual data collection and rely on Industrial-IoT (IIoT)-powered time study.
“An IIoT-powered time study uses smart devices to automatically and accurately capture real-time data from machines to accurately establish the time taken by operators and machines to complete each task along the production line.”
Identifying bottlenecks and excess capacity in the production process
Based on the data at hand, manufacturers are required to calculate and identify the work stages along the production line that have cycle times exceeding the takt time. These are the ‘bottlenecks’.
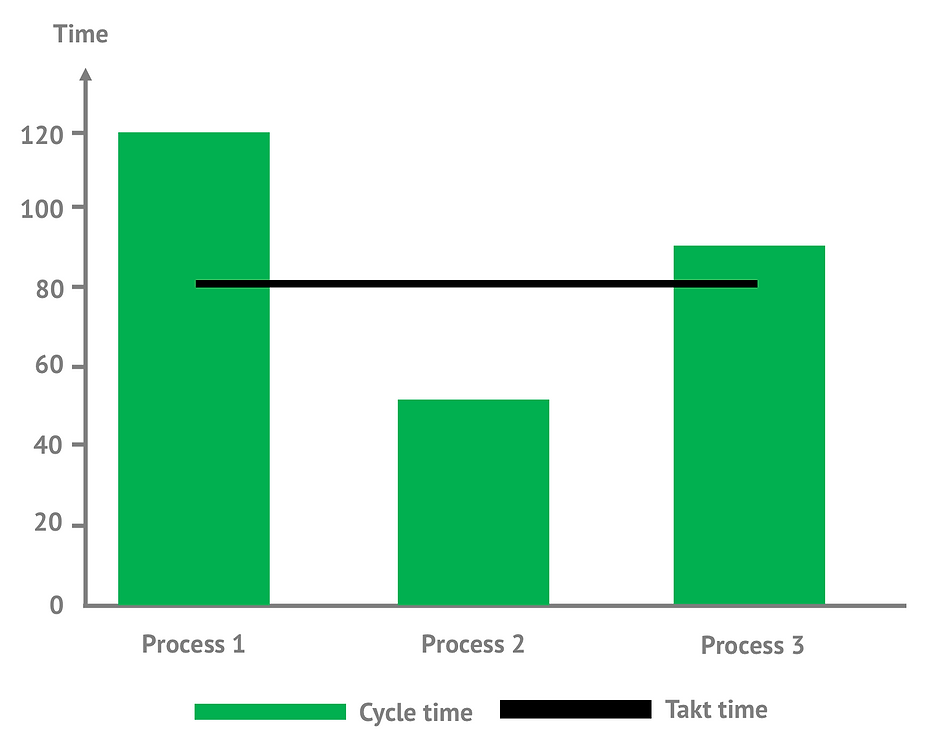
“Bottlenecks are points in a given process where the flow of tasks is hindered or stopped because they receive work requests faster than what they can process at maximum throughput capacity. Bottlenecks impact the capacity of the whole chain and may result in failure to meet the rate of customer demand.”
On the other hand, workstations that have cycle times below takt time indicate that there is excess capacity.
Without IIoT technologies, it may be time-consuming to manually calculate the takt time for each work stage. Using IIoT however, calculations such as cycle time are automatically calculated and production floor managers can be alerted of bottlenecks and excess capacity in real-time. Not only so, other system-level insights such as the Overall Equipment Effectiveness (OEE) of each production line can also be displayed on a dashboard. The higher the OEE, the faster the production line is producing good parts with little stop time. This is valuable information that manufacturers can use to prioritise line balancing activities according to urgency—from the worst-performing production line (i.e. lowest OEE) to the better performing ones— and better manage the trade-offs between effort and results.
Listing the sequence of tasks and drawing a precedence diagram
Firstly, list the various tasks in the production line according to sequence and indicate the immediate predecessors – the tasks that must be completed before the next task.
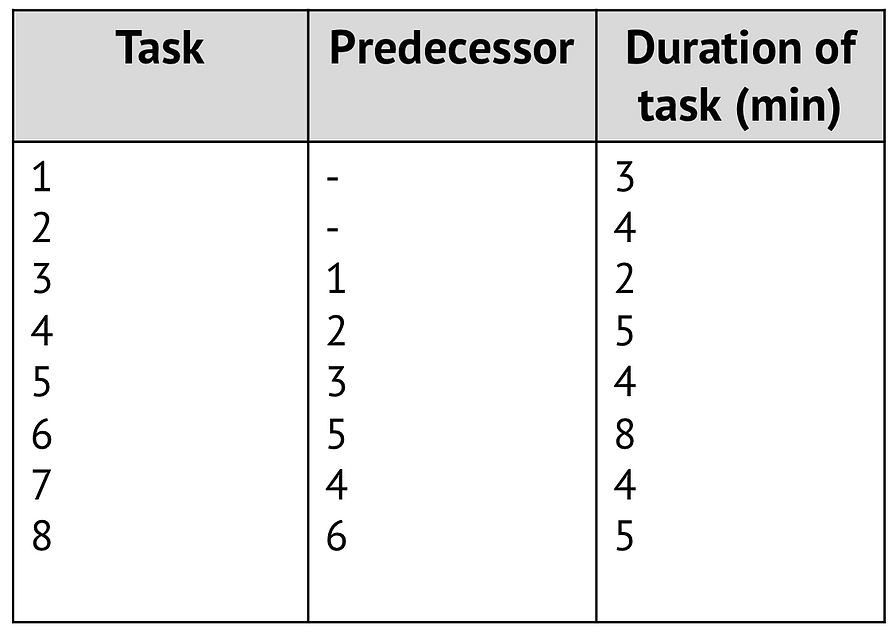
Since Task 1 is the predecessor of Task 3, Task 1 has to be completed before Task 3.
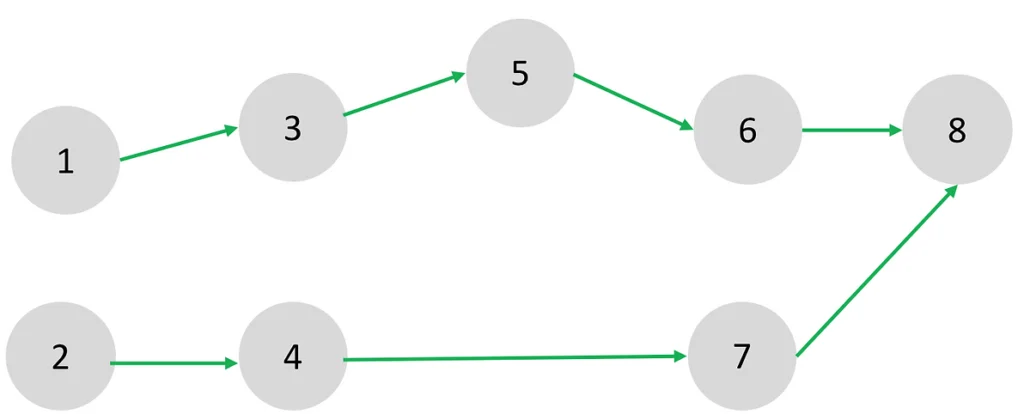
Draw a precedence diagram according to the sequence listed.
Rearranging tasks to eliminate bottlenecks and excess capacity
While the sequence of tasks is usually fixed and cannot be changed, there is the flexibility to rearrange or readjust the size of labour and resources along the production line so the cycle time is better aligned with the takt time (i.e. to better meet demand rate).
The most straight-forward method of rearranging is to shift resources from the workstations with excess capacity to those which are the bottlenecks. For instance, if a workstation has three operators and is currently operating with excess capacity, one operator may be shifted to the workstation which is struggling to produce. This kills two birds with one stone — it slows down the process with excess capacity by increasing cycle time while speeding up the bottleneck process by reducing cycle time.
How else can we rearrange resources? A more complex way of doing so is through parallel processing — that is to decouple each of the manufacturing steps and arrange them into groups so multiple tasks can take place simultaneously and labour resources are shared. For example, based on operator performance and machine utilisation data, the formulation and blending workstations can be grouped into one group whereas packing and cleaning are grouped into another. This sharing of workload among operators and combining of processes help to reduce the discrepancy in workload across operators from different work stations, leading to more uniform cycle times.
Going one step further – production levelling
The growing number of low volume and high mix production demands, and interoperability of real-time data – from the warehouse to the factory, and the customers—have generated anticipation and impetus and for manufacturers to not just better perform line balancing but also improve on current production levelling processes.
Example of production levelling
“Production levelling has been around for more than 50 years. It is defined as the production of a mix of models in each batch to smoothen out the unevenness in a production process and reduce the chances of overburdening resources.”
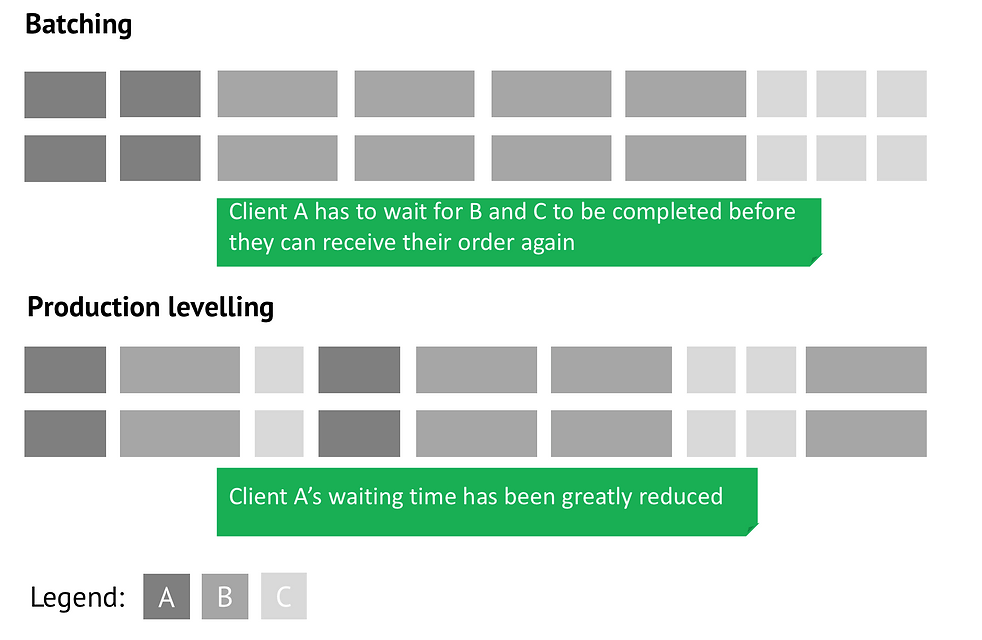
Consider the case where a manufacturer produces three types of watches, A, B, and C. Manufacturers who mass produce may have a batch production schedule that looks like this: AA,BBBB,CCC. There are reduced waste and equipment changeovers but it does not take into account the idle capacity and extended downtime incurred by the assets while waiting for C to be finished. Additionally, clients have to wait for an extended period for each batch to be finished before they can receive their next order. For example, regardless of how urgent client A wanted to order more of A to meet their increase in sales, they have a long waiting time for the factory to finish producing B and C before they can receive their next order.
On the other hand, a production levelling schedule could look like AB,CABB,CCB. This mixed production schedule helps to balance production more evenly across the work stations (i.e. operators and machine producing parts for A would not stay idle while waiting for B and C to be completed) and is better able to meet the popular demands of clients.
Overcoming the challenges of production levelling
Despite its benefits, implementing production levelling is not without its problems. Firstly, there usually exists an inherent ‘lag’ between the manufacturers and clients where manufacturers do not know how their customers’ demands are changing and cannot change production levelling schedules to react promptly; secondly, manufacturers face difficulties in accurately measuring the improvements made from production levelling and further optimising them.
How can we overcome these challenges? In our experience, the use of technologies such as IoT can increase the flexibility of production levelling schedules by collecting accurate data to improve visibility across the supply chain and help manufacturers stay abreast of real-time customer demands. For example, IoT-enabled sensors and RFID work hand-in-hand to monitor inventory, assets and finished products from end-to-end—from within the production floor to the customers. This provides manufacturers with real-time information on manufacturing cycle times, material flow, and higher predictability on customer’s demands so production levelling decisions can be made quicker and more accurately. As manufacturers are constantly kept in the loop, they can quickly tweak the production levelling schedule to meet last-minute orders or changes in order volumes.
Manufacturers are also able to test and compare the results of different production levelling schedules to find the most optimal one. By integrating the data to a robust analytic platform, information such as setup time, changeover time, machine downtime, bottlenecks, and performance of operators will be automatically recorded and calculated for each production levelling schedule that has been run. With these insights and data points, manufacturers can easily identify the better performing production levelling schedules and gather good learning points (e.g. such as how to best changeover and schedule operators, which complementary parts and products should be manufactured together) for future product levelling schedules.
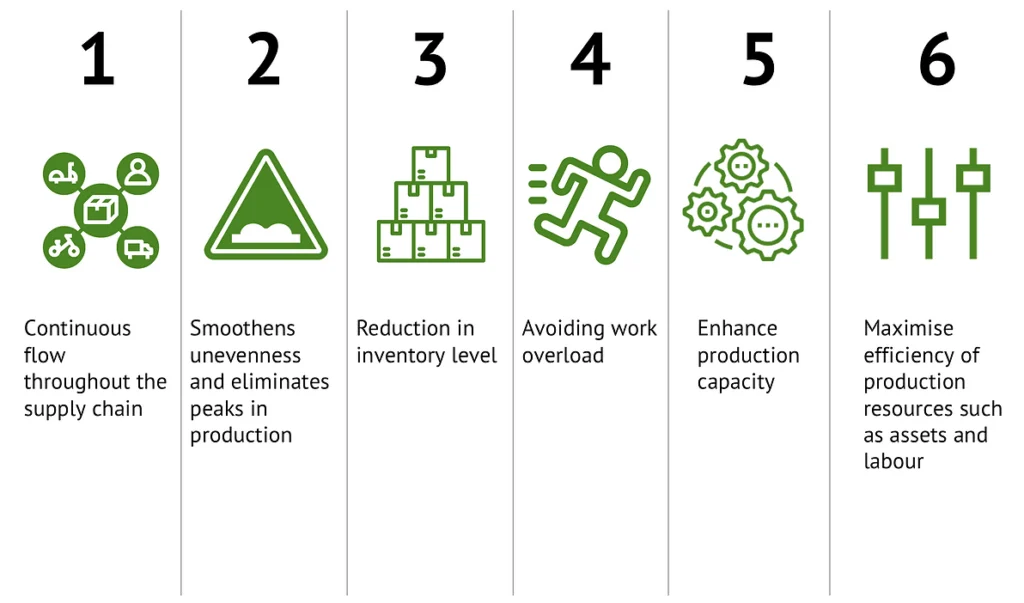
Benefits of line balancing and production levelling with real-time data
Conclusion
Performing line balancing and production levelling can help manufacturers strike a better balance between machine and labour utilisation, and embrace sudden changes in production demand. Bias-free, real-time data is the cornerstone of any line balancing and production levelling—they provide a fair basis of comparison for the results pre and after balancing/levelling and offer insights for continuous improvement and optimisation in the increasingly complex manufacturing scene.